
In California, municipalities are required to show that their zoned capacity, the number of homes that could theoretically be built under the current zoning, meets the housing target assigned by the state. As you’d expect, these targets are gamed by using fake zoned capacity. One city listed its own city hall building as a likely redevelopment site.1 How do we fix this? By using feasible zoned capacity that is profitable to build at current prices. The city hall building would only be redeveloped if rents reached astronomical levels; it’s theoretical capacity, but not feasible capacity.
More generally, zoned capacity can be stranded and infeasible due to redevelopment costs. It’s cheap to tear down a bungalow, so zoning for a 5-storey apartment building is feasible capacity. But it’s very expensive to tear down a low-rise apartment building; capacity for one extra floor is infeasible. Each scenario adds four floors of housing, but only one will actually get built. Not all zoned capacity is the same.
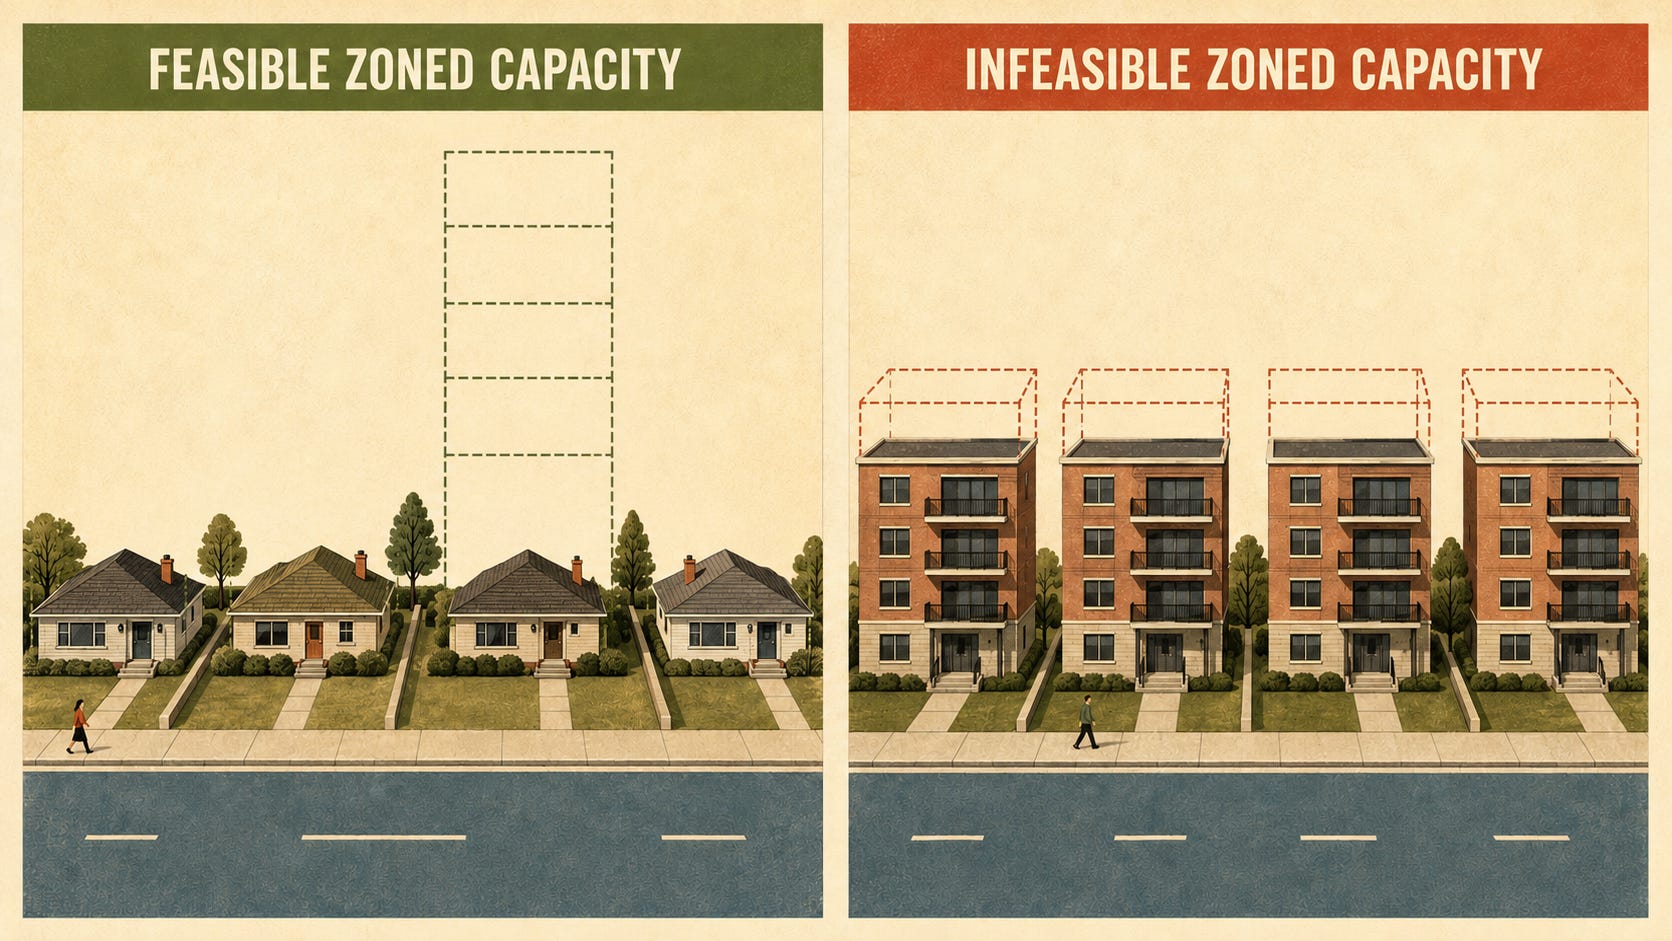
We can think of zoned capacity as the housing supply curve QS(P) evaluated at infinite prices: QS(∞). If rents reached $10,000/month, it could be worth it to tear down those 4-storey buildings and redevelop at 5-storeys. When NIMBYs say “we have enough zoned capacity”, they are asking us to wait until rents rise to unbearable levels. This just shows that they don’t care about housing affordability.
This graph shows how two cities with the same theoretical zoned capacity can have very different affordability outcomes. City A is mostly bungalows and has liberal zoning, so 80% of the capacity can be built with rents below $3,000. In contrast, City B is mostly apartment buildings with restrictive zoning, so rents need to rise above $8,000 to produce the same number of homes.
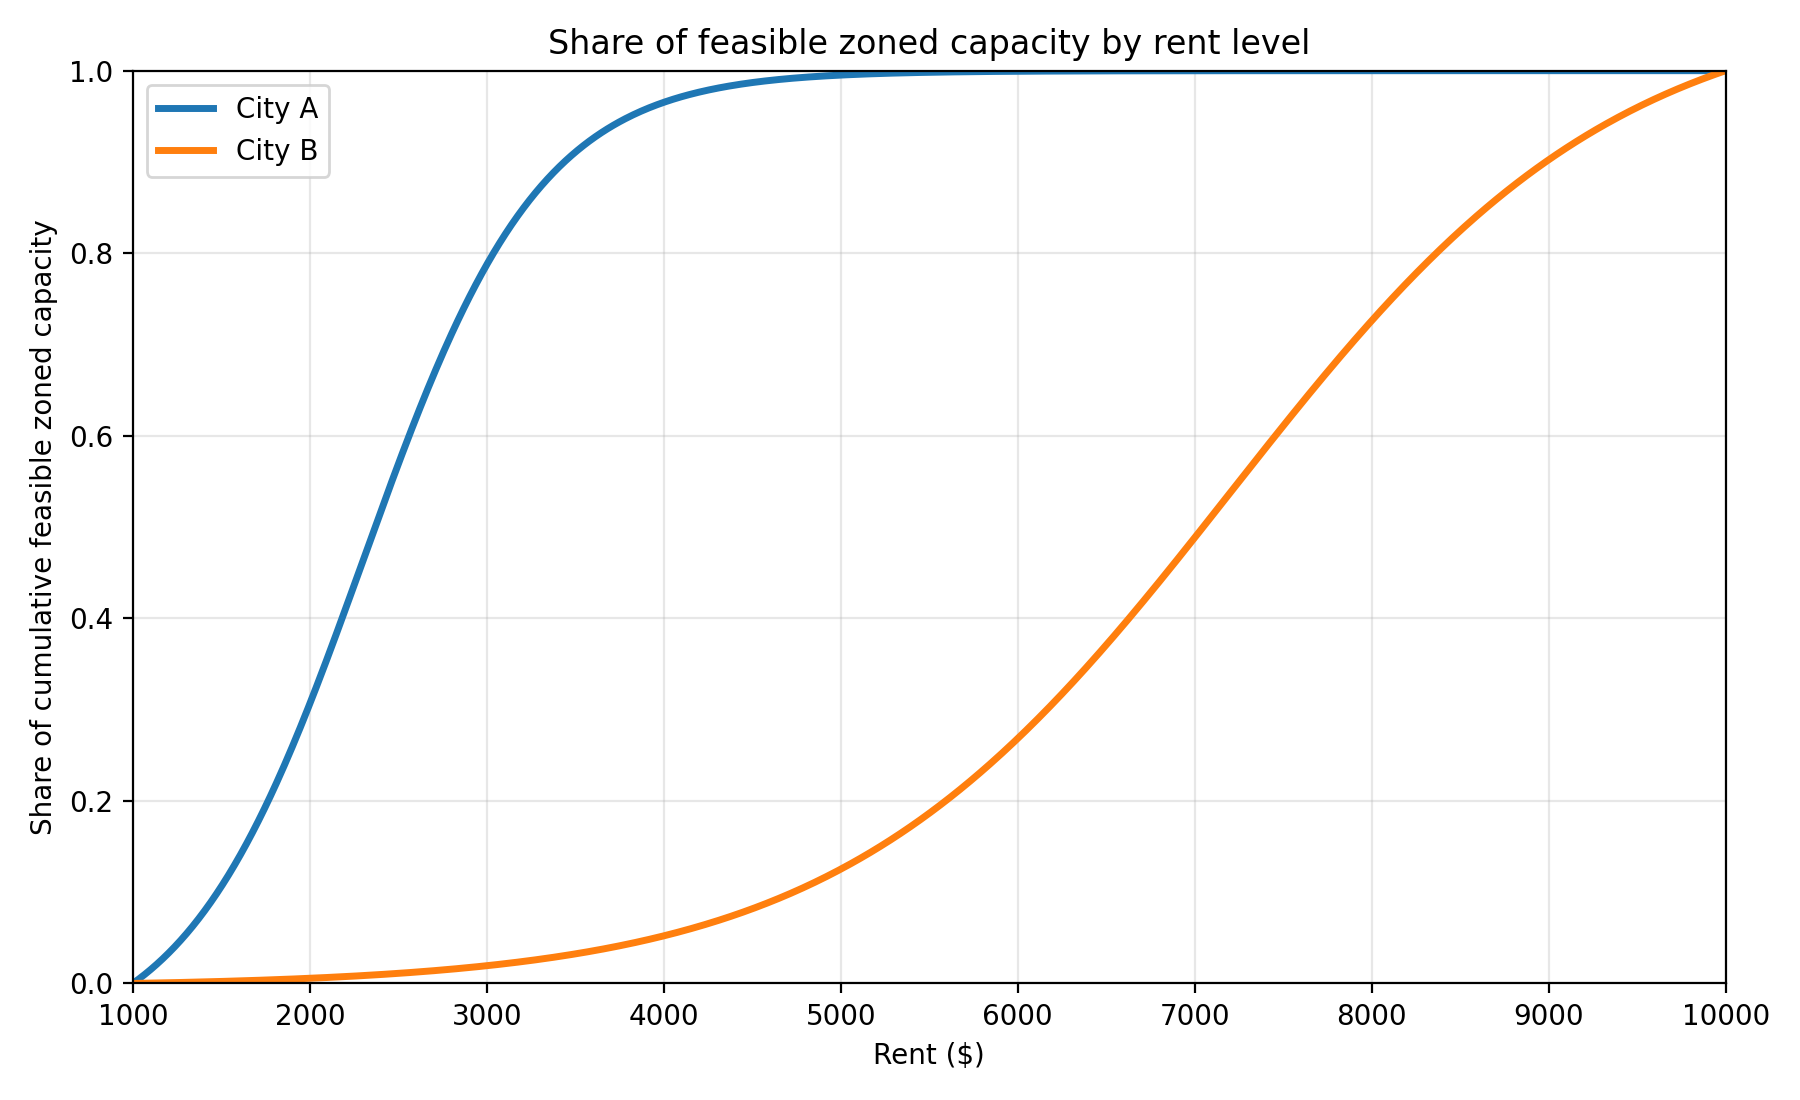
In practice, we want to know how much of the nominal capacity can be produced at reasonable rents. We always need to ask “capacity at what price level?”. And the point of upzoning is to shift the supply curve and add capacity that is profitable to build at lower prices. The holy grail is zoned capacity that brings down rents.
So how do we measure feasible zoned capacity? One approach is a parcel-level ‘pro forma’ model, where for each parcel we calculate the optimal project and the probability of development, given current prices and construction costs; see the Terner housing policy simulator and this Grattan report. A more technical approach is to estimate a structural model and construct the aggregate supply curve. Rollet’s model could be used to quantify how much of NYC’s zoned capacity is feasible at specific rent levels.
Read more in my deep dive on upzoning:

Early in the 6th cycle, for example, the City of Vista listed both its own City Hall and public library as sites likely to be torn down and redeveloped as high-density housing. South Pasadena, another affluent suburb dominated by single family homes, predicted that every major grocery store within its borders would be redeveloped into affordable housing. And the pastor of a church in the wealthy enclave of La Canada Flintridge told a local newspaper that she agreed to let the city list church property as a site for future affordable housing, since “everyone knows” it will “never be built.”