
Jevons’ paradox is the idea that improved resource efficiency can lead to higher total use of the resource. The key distinction is between the resource and the service that is produced using the resource. For example, gasoline is a resource used to produce vehicle travel. More topically, GPUs are a resource used to produce AI services. As algorithms become more efficient, will demand for GPUs fall? Or, will better algorithms reduce AI prices, leading to increased demand for AI services and driving up consumption of GPUs?
There are two opposing effects underlying the paradox. The engineering effect is where improved efficiency means each unit of the service requires less of the resource. But through the demand effect, improved efficiency lowers the price of the service, which increases service demand, thereby increasing demand for the resource. When the demand effect is large enough, it outweighs the engineering effect, and Jevons’ paradox occurs.
To model Jevons’ paradox, we need two markets: one for the resource, and one for the service. Since the resource is the input used to produce the output, the markets are connected. Hence, any supply and demand explanation of Jevons’ paradox requires two supply and demand graphs.
Let’s use the example of fuel efficiency. The service is vehicle travel, which is produced using the resource of gasoline. Vehicle travel is priced in dollars per mile, and gasoline is priced in dollars per gallon; fuel efficiency is miles per gallon. So the Jevons question is: does improved fuel efficiency lead to increased usage of gasoline?
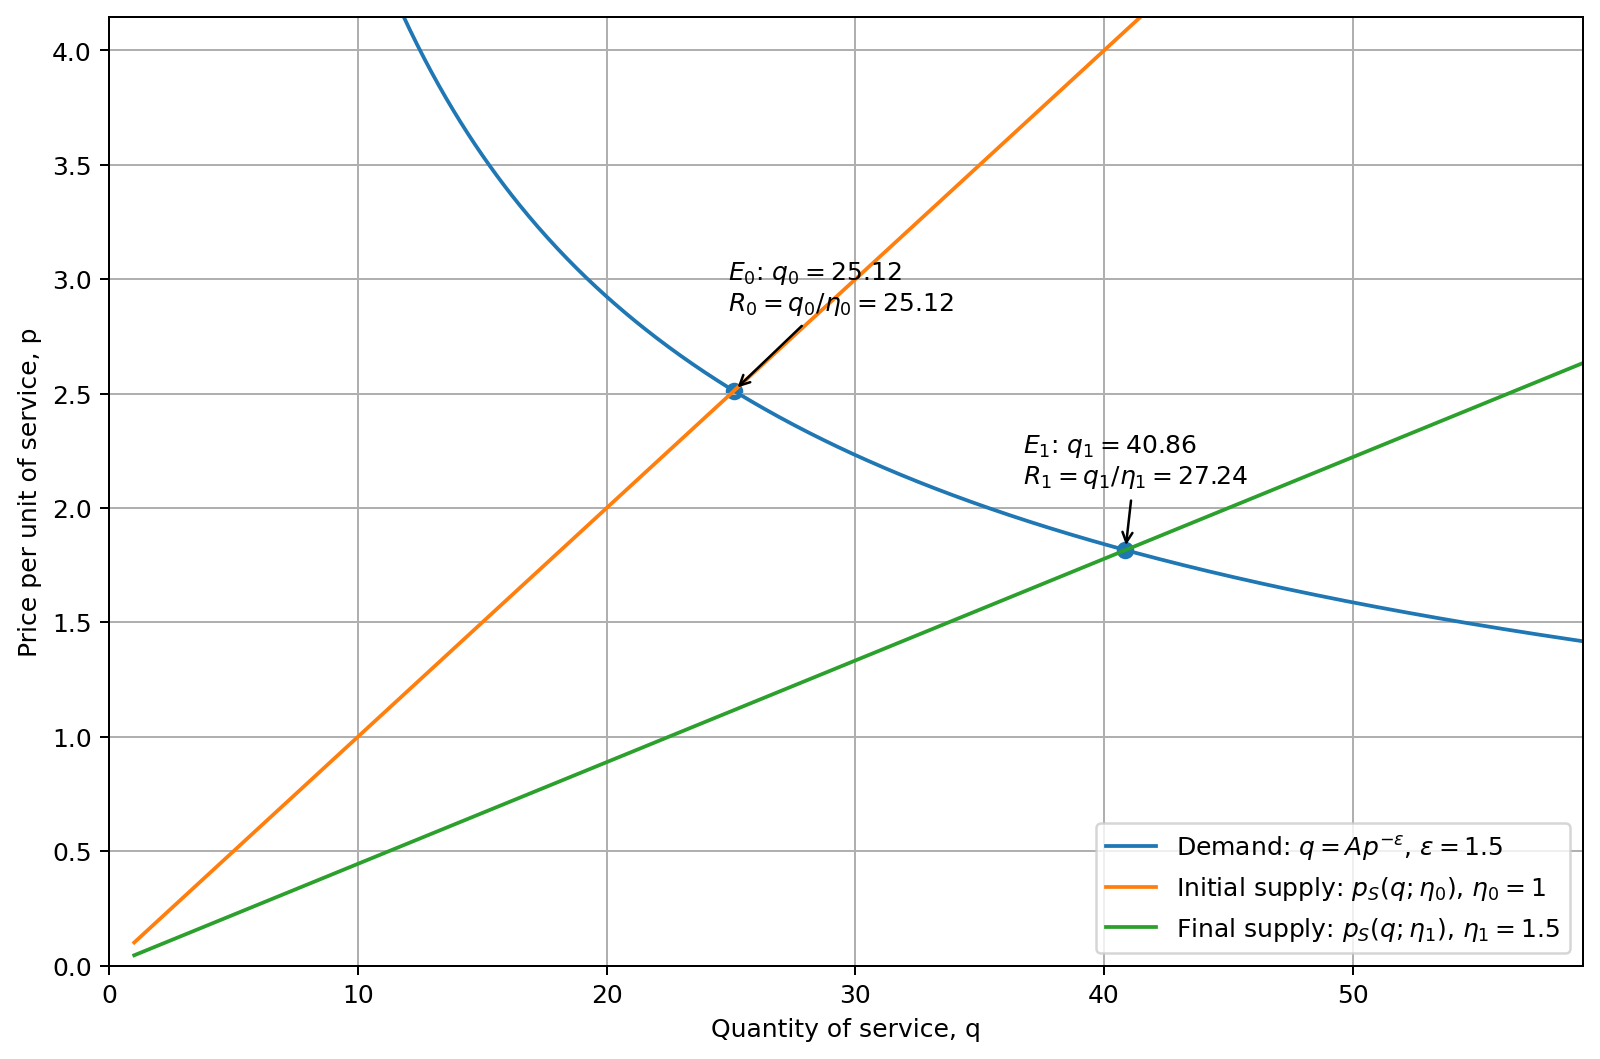
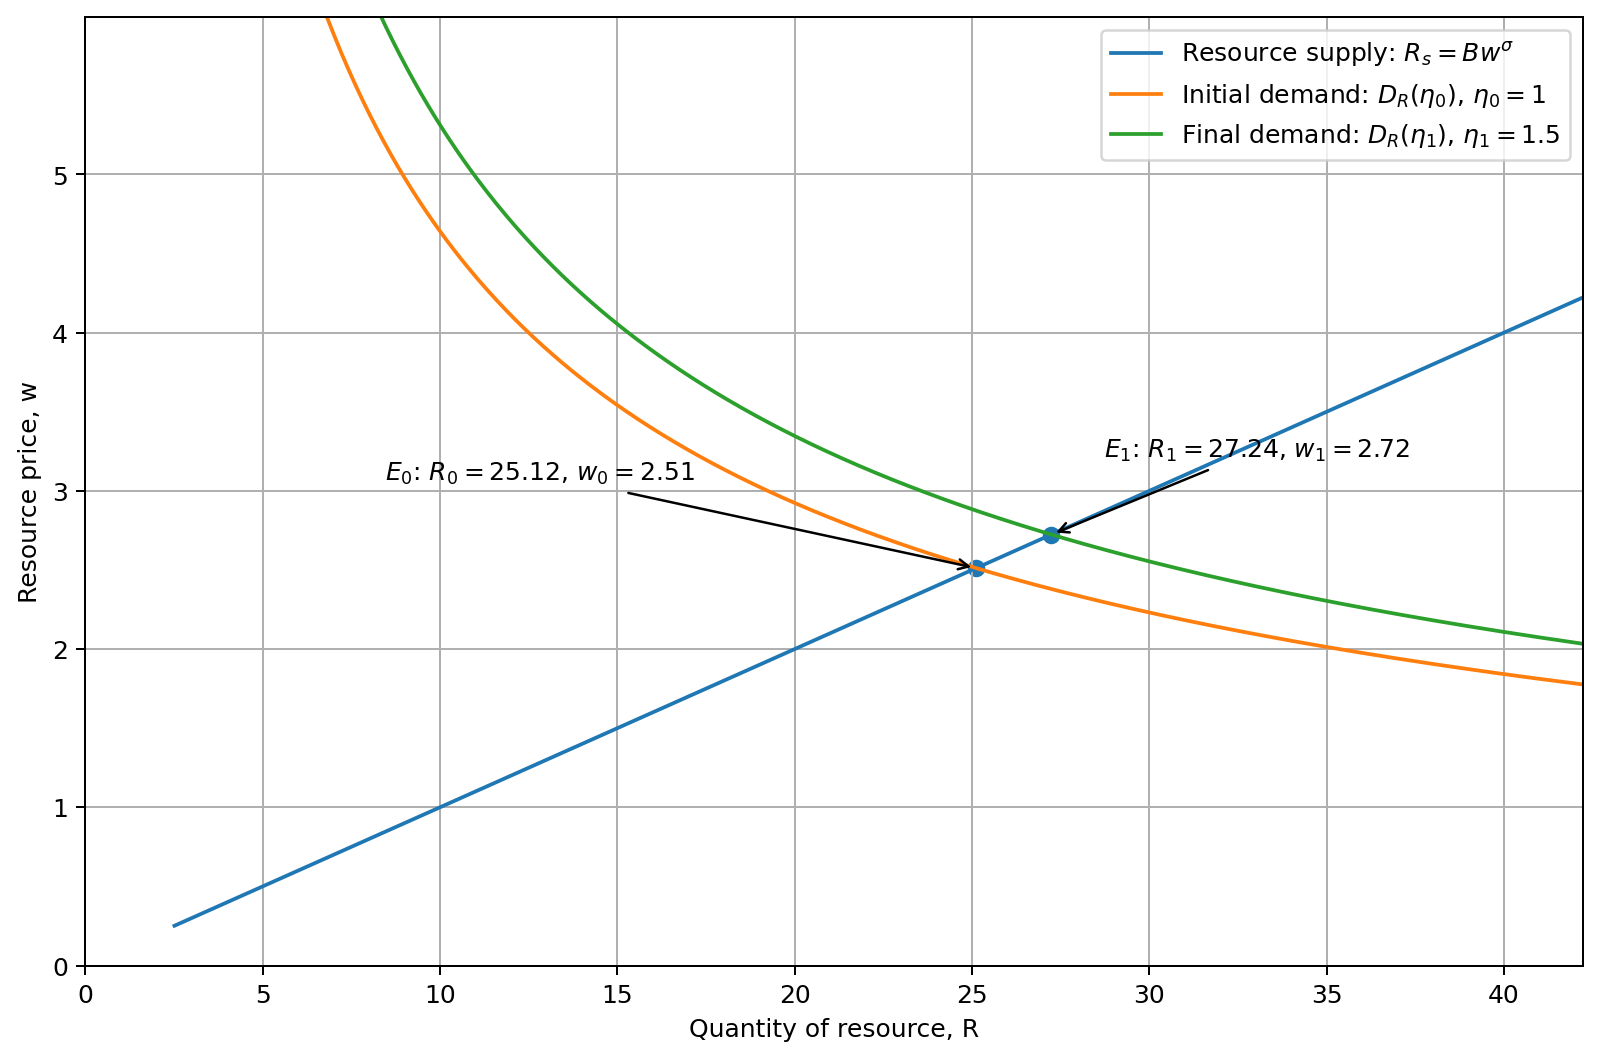
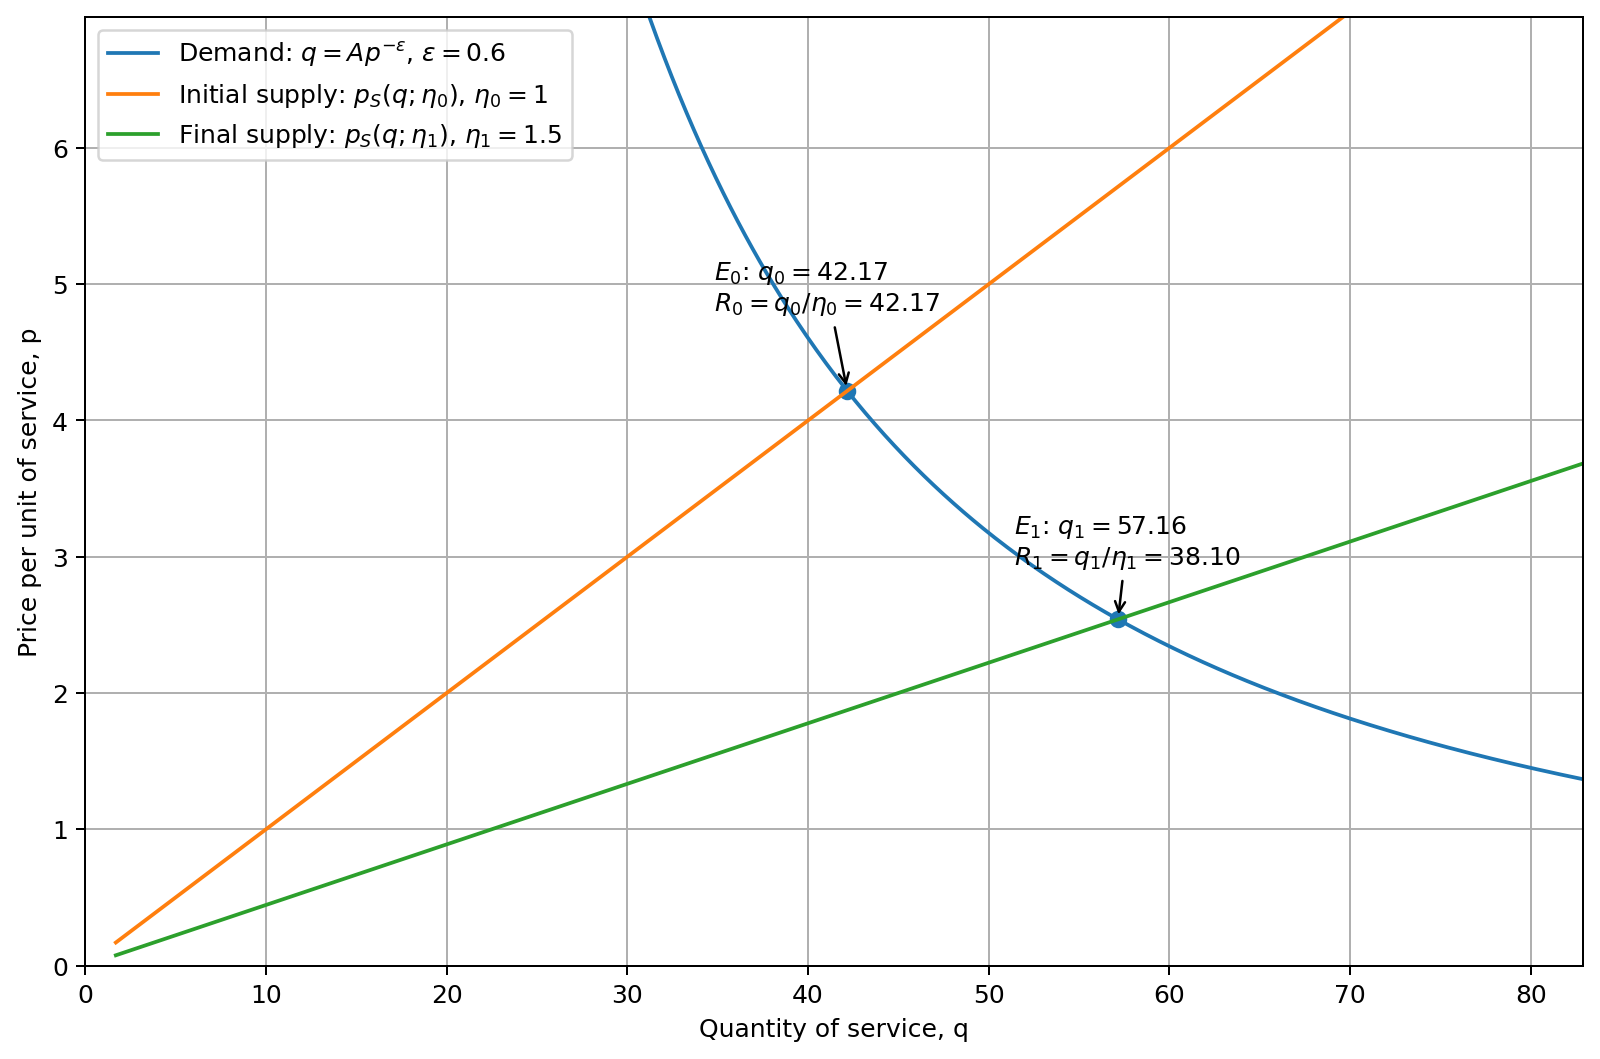
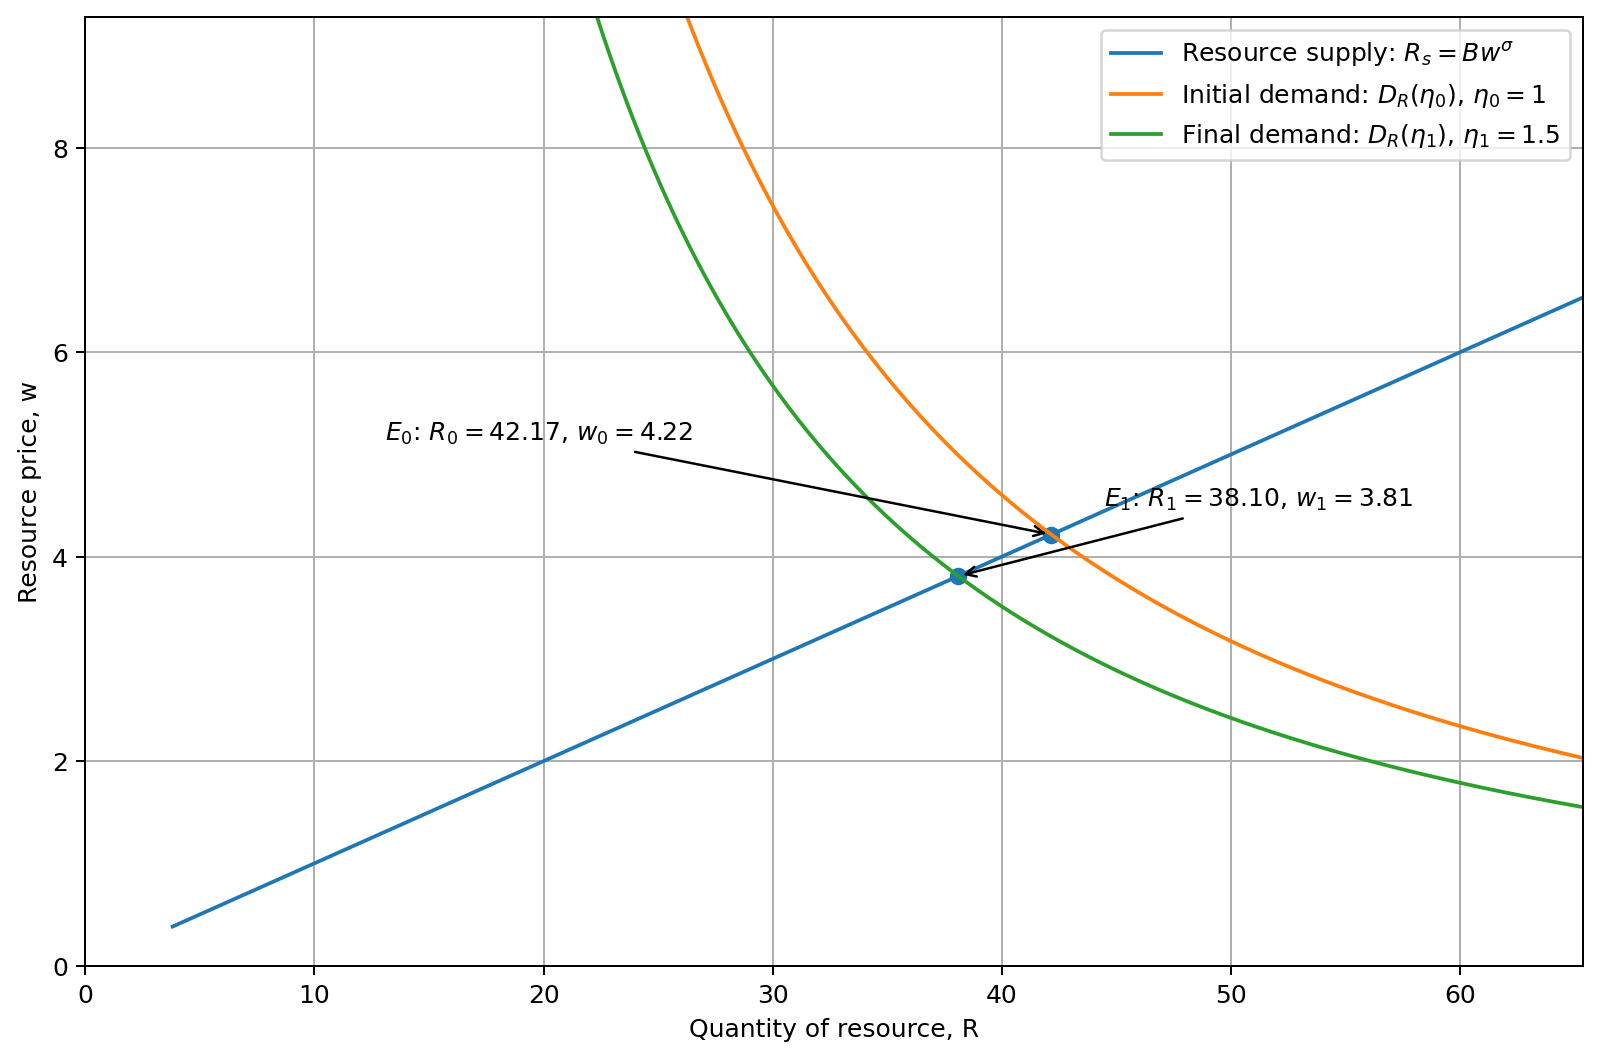
Graphically, an increase in fuel efficiency shows up as a rightward-shift in the travel supply curve, as each unit of travel is now cheaper to produce, and either a left or right shift in gasoline demand, depending on the elasticity of travel demand.
Elastic demand: Jevons’ paradox, gasoline use increases
When demand for vehicle travel is elastic, the shift in the travel supply curve increases the quantity of travel demanded by enough that gasoline usage increases. Here, efficiency increases by 50%, but travel quantity increases by more than 50%, so the gasoline demand curve shifts right, and the quantity of gasoline rises.
Inelastic demand: no paradox, gasoline use falls
But when demand for travel is inelastic, the travel supply curve shifts right, but the increase in travel quantity is smaller, so gasoline usage decreases. Here, efficiency increases by 50%, but the quantity of travel increases by less than 50%, so the gasoline demand curve shifts left, resulting in lower gasoline usage.
See here for a formal model. Note the similarity to my model of housing produced using land.
Appendix: Wikipedia doesn’t get it
The graph on the current Wikipedia page is incoherent. It combines the travel and gasoline markets, with the fuel price on the y-axis and the quantity of travel on the x-axis. But there should be two graphs: (fuel price, fuel quantity) and (travel price, travel quantity). They never show the quantity of fuel, and hence cannot actually demonstrate the core result of fuel quantity increasing.
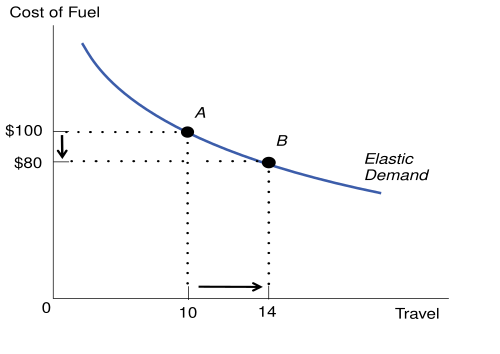
Model with fixed fuel price:
https://resources.environment.yale.edu/gillingham/ChanGillingham_ReboundTheory.pdf